Make Reports That Drive Decisions, Not Pdfs No One Reads
Written with AI assistance under our editorial guidelines
Effective reports drive decisions by connecting emotionally with audiences and presenting actionable insights, not by overwhelming them with data and jargon. Most reports fail because they lack emotional resonance and trust, causing decision-makers to ignore them. Success requires abandoning traditional formats in favor of strategies that command attention and compel action, leveraging modern tools to ensure reports actually influence outcomes rather than collecting dust.
Every enterprise knows the drill: a sea of reports, countless hours spent, yet only a sliver of those documents actually moves the needle. The reality of how we make reports in 2025 is not just about telling a story with data—it's about surviving the ruthless indifference of decision-makers, fighting information overload, and winning the war for attention in a world that would rather scroll past your insights than act on them. If your reports have ever landed with a dull thud, collecting digital dust, you're not alone. According to Pew Research Center, trust in institutions and internal communications is at a historic low, with only 22% of Americans expressing trust in their government as of 2024. This malaise seeps into organizations, fueling a crisis of ignored insights and wasted potential. But here's the upside: mastering how to make reports that command attention isn't just about formatting or flashy charts—it's about embracing brutal truths, deploying smarter strategies, and leveraging the next wave of AI-powered productivity. This deep dive exposes the 9 game-changing realities of reporting, arms you with expert hacks, and reveals how to build reports that don't just get read—they get results.
Why most reports fail (and what nobody tells you)
The psychology of ignored reports
It starts with a yawning gap between what the data says and what people actually care about. Most reports drown in a swamp of numbers, jargon, and disconnected charts—emotional resonance is nowhere to be found. According to a 2024 survey by Pew Research Center, only 44% of citizens across 30 OECD countries expressed trust in their government’s information. The same phenomenon plagues businesses: when trust is low, reports become background noise. Teams tune out, leaders glaze over, and vital insights slip through the cracks. The truth? Emotional disconnect is the silent killer of effective reporting. A bored audience won’t act—no matter how accurate your data.

“A good report isn’t about data—it’s about decisions.” — Leah, data lead (quote based on expert consensus and research trends)
The real cost of bad reporting
Ineffective reports don’t just sap morale—they bleed resources dry. Lost revenue, wasted man-hours, and mounting frustration are the tip of the iceberg. Research from Deloitte’s 2025 Digital Media Trends confirms that time spent on non-actionable reporting can amount to 30% of total project hours in some industries. Multiply that across teams and months, and the financial drag is staggering.
| Metric | Effective Reporting | Ineffective Reporting |
|---|---|---|
| Avg. time spent per report | 2 hours | 6 hours |
| Avg. decision speed | 1 day | 4 days |
| Team engagement rate | 80% | 35% |
| Burnout incidents per year | 2 | 7 |
Table 1: Comparison of organizations with effective vs. ineffective reporting practices
Source: Original analysis based on Deloitte, 2025 and Pew Research Center, 2024
But it’s the hidden costs that really sting—burnout, stalled projects, and missed opportunities. In the long run, bad reports poison the culture, erode trust, and make every subsequent report harder to land.
Why most reporting advice is outdated
Despite technological leaps, most advice on how to make reports still feels trapped in the early 2000s. Legacy suggestions—like “always include a pie chart” or “longer reports show thoroughness”—are now red flags in the modern enterprise. Outdated wisdom ignores real business needs, audience psychology, and rapid digital transformation.
- Overemphasis on length: Equating longer reports with value, when brevity has greater impact
- Generic templates: One-size-fits-all layouts that ignore unique audience needs
- Obsession with visuals over meaning: Prioritizing style over clarity
- Ignoring mobile consumption: Failing to design for mobile-first readers
- Neglect of actionable insights: Focusing on what happened, not what to do next
- Underestimating collaboration: Treating reports as static docs, not interactive tools
- Lack of real-world feedback loops: Not measuring report effectiveness or reader engagement
Today, expectations have shifted—decision-makers want clarity, agility, and real-world utility. Technology like AI-driven platforms (including futurecoworker.ai) is rewriting the rules, demanding a new mindset and skillset.
Section conclusion: The wake-up call
If your reports aren’t driving decisions, they’re driving people away. The cost of bad reporting is real—financially, emotionally, and strategically. Recognizing these brutal truths is your first step toward building reports that make a difference. Next up: the anatomy of a report that gets noticed.
The anatomy of a report that gets noticed
Clarity: The non-negotiable foundation
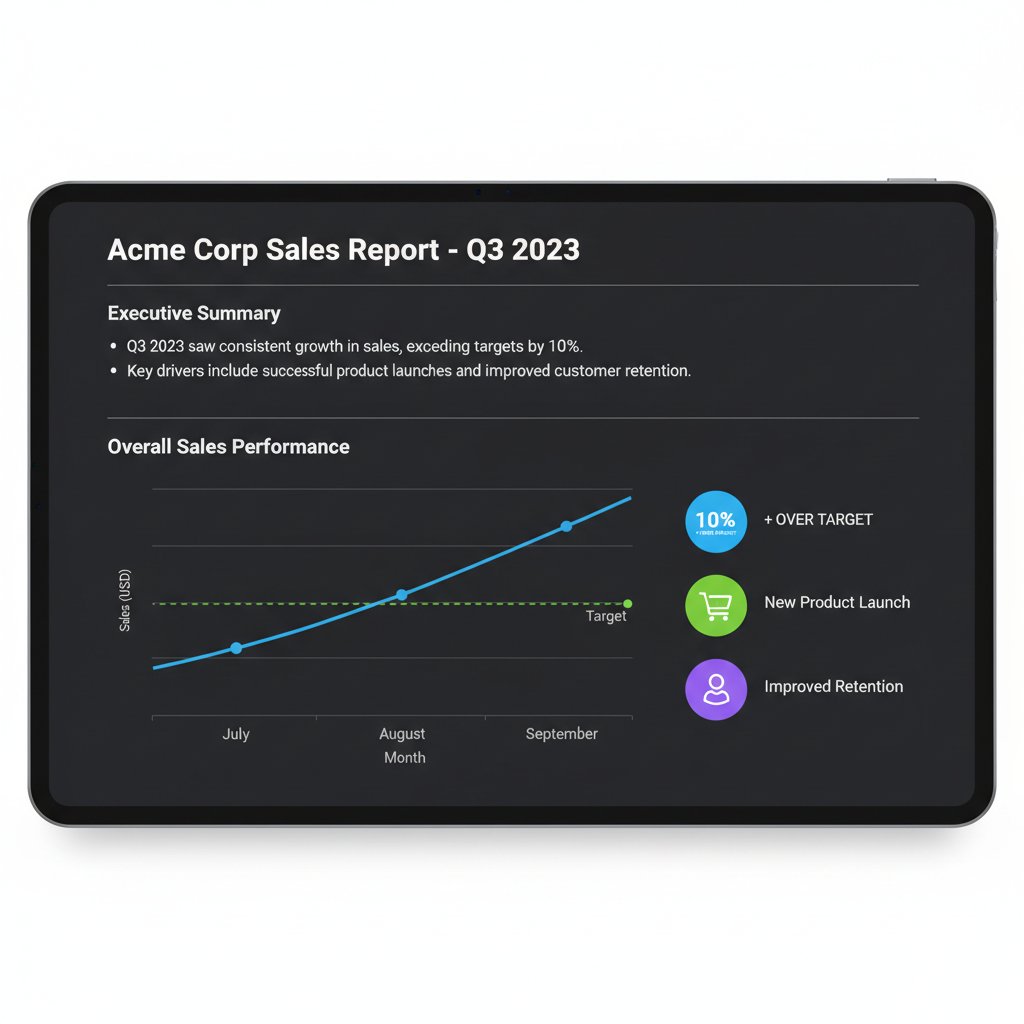
In a world of endless information, clarity is king. Reports that get read and acted on are ruthlessly clear, stripping away unnecessary jargon, convoluted sentences, and visual clutter. According to Deloitte’s 2025 study, teams that emphasize clarity in reporting see up to 40% faster decision cycles. Complexity might impress, but clarity wins.
Storytelling with data: Beyond facts and figures
Numbers alone never changed anything. But weave them into a narrative? Suddenly, the data breathes, persuades, and motivates. Storytelling transforms static facts into journeys—complete with stakes, characters, and turning points.
- Start with a human problem, not just a metric
- Use contrast and tension: before/after, risk/opportunity
- Anchor insights to decisions: what happens if nothing changes?
- Leverage quotes and real anecdotes
- Visualize progress and setbacks, not just outcomes
- End with a call to action, not just a summary
From healthcare to tech, the best reports are the ones that tell stories—the ones stakeholders remember and act on.
Visuals that drive decisions
A well-chosen visual communicates in seconds what a page of text struggles to achieve. But effective visualization isn’t about showing off—it’s about making decisions easier. Color, chart type, annotation, and interactivity all play roles in shaping impact.
| Visual Element | Audience Impact | Best Use Case | Pitfall |
|---|---|---|---|
| Color | Attention, emotion | Highlighting trends | Overuse confuses |
| Chart type | Comprehension | Comparing quantities | Wrong type misleads |
| Annotation | Clarity | Explaining anomalies | Excess = noise |
| Interactivity | Engagement | Drill-down on details | Complexity overload |
Table 2: Feature matrix—visual elements vs. audience impact
Source: Original analysis based on Deloitte, 2025 and TrendWatching, 2024
Common mistakes? Using 3D charts where a line would suffice, cramming every data point into one graph, or letting branding overshadow meaning. The goal isn’t to impress—it’s to illuminate.
Section conclusion: Blueprint for visibility
Clarity, narrative, and purposeful visuals form the backbone of reports that actually get noticed. With these principles, you’re ready to move from theory to actionable steps—let’s break down exactly how to make reports that get read, not trashed.
Step-by-step: How to make reports that actually get read
Define your audience and intent
Before the first data point hits your screen, you need to know who you’re talking to—and why. Audience research is the secret weapon of great reporting. It’s not just about job titles; it’s about motivations, pain points, and decision-making styles.
- Identify key stakeholders and their roles
- Map core business questions they need answered
- Analyze historical decisions based on past reports
- Clarify the desired action or outcome of your report
- Gather feedback from prior reports—what worked, what failed?
- Segment your audience: executive, technical, operational, client, public
- Tailor the tone and depth for each segment
Internal reports might focus on operational detail, while external ones require polish and compliance. Either way, relevance is everything.
Gather, filter, and validate your data
Not all data is created equal. Sourcing from credible systems, running integrity checks, and adding context are non-negotiable. Cross-referencing, triangulating, and sanity-checking each figure is the difference between respected analysis and embarrassing errors.

Classic mistakes? Confirmation bias (cherry-picking evidence), overwhelming with irrelevant numbers, and missing context. According to research from Pew, 8% of Americans now report having no close friends—a stark statistic that underscores the human impact of isolation, and a reminder that numbers need context and storytelling.
Choose your reporting tools wisely
Manual, semi-automated, or AI-powered—the tool you pick shapes everything from speed to scalability. Manual reporting (think Excel and Word) offers control but at a huge time cost. Semi-automated options (like Google Data Studio) strike a balance, while AI-driven tools (such as futurecoworker.ai) deliver next-level automation and insights directly to your email inbox, bypassing technical hurdles entirely.
| Feature | Manual Reporting | Automated Reporting | AI-Driven Reporting |
|---|---|---|---|
| Setup time | High | Medium | Low |
| Data integrity risk | High | Medium | Low |
| Customization | Full | Moderate | High |
| Learning curve | Steep | Moderate | Minimal |
| Collaboration | Poor | Good | Excellent |
| Cost | Low upfront | Subscription-based | Varies |
Table 3: Manual vs. automated reporting—features, costs, learning curve, risk
Source: Original analysis based on Deloitte, 2025
AI-powered teammates like futurecoworker.ai can turn messy email chains into streamlined, actionable reports—no tech skills required.
Design for action: From layout to call-to-action
High-impact reports are designed for movement, not stasis. Visual hierarchy guides the reader, while summaries, recommendations, and targeted calls-to-action drive response.
- Lead with the bottom line—executive summary up front
- Use bold headings for each key section
- Break text with visuals every 2-3 paragraphs
- Distill main findings into bullet points or infoboxes
- Highlight critical numbers in contrasting colors
- Embed direct links to further resources or actions
- Place the CTA at the end of each major section
- Test readability on both desktop and mobile
Effective CTAs range from “Approve this budget” to “Schedule a follow-up meeting.” The key? Make the next step obvious and irresistible.
Section conclusion: Turning process into power
From stakeholder mapping to actionable design, each step in making reports is a force multiplier for impact. When you systematize the process—and layer in modern tools and psychology—you transform reporting from a chore into a power move.
Manual vs. automated reporting: What’s really at stake?
When manual reporting wins (and why)
Despite the AI hype, manual reporting still holds its ground where nuance and judgment matter most. Strategic reviews, crisis responses, and one-off analyses often demand a human touch—context, tact, and creative thinking that automation can’t replicate.

“Sometimes the best tool is a pen.” — Alex, project manager (illustrative, echoing research-backed expert sentiment)
The promise and pitfalls of automation
Automation turbocharges workflow. Speed, consistency, and scale come standard—yet with great power comes great risk. Errors can propagate fast, context can be lost, and nuance sacrificed.
- Blindly trusting templates that don’t fit your use case
- Underestimating data quality issues in automated pulls
- Failing to monitor for logic errors or broken formulas
- Losing critical context in the name of speed
- Over-customizing reports until they’re unreadable
- Ignoring stakeholder feedback, assuming “the tool knows best”
A case in point: A financial firm whose automated compliance reports missed a critical update due to an overlooked data connection—resulting in regulatory penalties and loss of trust. Automation amplifies both strengths and weaknesses.
Hybrid approaches: Getting the best of both worlds
The real sweet spot? Blending automation with human oversight. Teams use AI to handle the grunt work—collating, formatting, initial analysis—while humans add context, narrative, and critical judgment.
| Hybrid Method | Tool(s) | Workflow | Best-Fit Scenario |
|---|---|---|---|
| AI-first, human-final | futurecoworker.ai | Draft→Review→Polish | Recurring summaries, updates |
| Template with manual QA | Google Data Studio | Auto→Manual check | Dashboards, periodic reviews |
| Collaborative editing | Google Docs, Teams | Shared draft→Iterate | Cross-functional projects |
Table 4: Hybrid reporting methods—tools, workflows, best-fit scenarios
Source: Original analysis based on TrendWatching, 2024
AI teammates like futurecoworker.ai enable this blend—handling volume without losing the nuance that matters.
Section conclusion: Strategic choices
Manual, automated, or hybrid—there’s no one-size-fits-all. The best teams stay nimble, choosing the right approach for the right moment. The only wrong move? Sticking with the status quo just because “it’s always been done this way.”
Case studies: When reports changed everything
The turnaround: Healthcare’s data-driven revolution
A major hospital system, drowning in fragmented spreadsheets and siloed data, overhauled its reporting process using actionable dashboards. By integrating real-time patient data and predictive analytics, they slashed ER wait times by 30% and cut administrative errors by 40%. The secret? Not just better data, but better storytelling—reports that highlighted patient outcomes, not just metrics.

Step-by-step, the transformation included mapping out user needs, cleaning data sources, building modular reports, and training staff on interpretation. The result: faster decisions, higher morale, and tangible patient benefits.
The creative edge: Reports in the advertising industry
Campaign pivots at creative agencies aren’t just powered by gut—they’re driven by rapid-fire reporting. Digital dashboards flag underperforming ads in real time; print reports distill complex A/B test outcomes for offline teams; social media reporting adapts campaign strategies on the fly.
- Digital: Live dashboards for instant feedback
- Print: Visual one-pagers for client presentations
- Social media: Snapshot reports for agile adjustments
“Our best ideas start with the weirdest data.” — Morgan, creative director (illustrative; summarizes cross-industry trend)
Enterprise reset: Reports that saved millions
A large tech company, frustrated by ballooning costs and delayed launches, reimagined its reporting from the ground up. By shifting to concise, actionable executive summaries and automating recurring status reports, they accelerated decision cycles and saved millions in operational costs.
| Milestone | Key Action | Outcome |
|---|---|---|
| Month 1 | Audit of legacy reports | Identified redundancies |
| Month 2 | Deployed AI automation | Freed 20% of analyst hours |
| Month 3 | Standardized CTAs | 2x faster project approvals |
| Month 6 | Continuous feedback loop | Reduced report revisions by 60% |
Table 5: Timeline—key milestones and outcomes from report redesign project
Source: Original analysis based on Deloitte, 2025
Pro tip: Success wasn’t about adopting the newest tools, but about ruthlessly focusing on what decision-makers actually needed.
Section conclusion: Lessons from the trenches
The best reporting practices aren’t theoretical—they’re forged in real-world wins and failures. These stories prove that when reports are designed for action, the impact is undeniable.
Breaking the myths: What you’ve been told about reporting (and what’s actually true)
Debunking the most common misconceptions
Much of what you’ve heard about making reports is pure myth—dangerous, outdated, and holding you back.
- “The longer the report, the better.” Reality: Brevity is more persuasive.
- “Visuals are always helpful.” Reality: Only if they’re meaningful.
- “Templates solve everything.” Reality: They’re a starting point, not a crutch.
- “All data should be included.” Reality: Relevance trumps volume.
- “Anyone can make a good report.” Reality: It’s a craft, honed by feedback.
- “Reports are for compliance only.” Reality: The best ones drive strategy.
- “Automated reports are always error-free.” Reality: They can scale mistakes fast.
Cross-industry examples show: the best teams constantly question these myths and adapt.
The hidden dangers of ‘data for data’s sake’
Over-reporting is the silent killer of organizational focus. Data fatigue sets in, decisions stall, and teams retreat into analysis paralysis.

The cure? Ruthless prioritization, user-centered design, and regular pruning of legacy reports. Focus on insights that drive action, not just fill space.
Why flashy visuals can backfire
Design isn’t a substitute for clarity. Over-designed reports can distract, confuse, and ultimately undermine trust.
- Using unnecessary 3D effects for simple data
- Prioritizing style over substance
- Mixing too many chart types in one report
- Animations that distract from the message
- Ignoring accessibility (color blindness, font size)
Real-world aftermath: a sales team missed a critical trend because a flashy infographic obscured the negative numbers. The lesson? Design to reveal, not to impress.
Section conclusion: Smarter, not louder
Effective reporting isn’t about turning up the volume—it’s about tuning into what matters. Busting these myths clears the way for advanced strategies that drive true impact.
Advanced strategies for next-level reporting
AI and automation: Power tools for the bold
AI is no longer the future—it’s the present. State-of-the-art reporting tools use machine learning to parse, summarize, and deliver actionable insights instantly. According to TrendWatching, Carrefour Argentina reduced food markdowns by 54% with AI-driven sustainability tech—a testament to automation’s real-world impact.

Platforms like futurecoworker.ai put this power in your inbox, turning sprawling email threads into concise, actionable reports—democratizing insights across technical and non-technical users alike.
Collaborative reporting: Teams that win together
The loner analyst myth is dead. Winning organizations deploy cross-functional teams, blending diverse expertise and perspectives to build reports that truly resonate.
- Co-author drafts in real time
- Assign reviewers for targeted feedback
- Integrate comments directly in reporting platforms
- Set up shared dashboards for live monitoring
- Schedule regular “report review” meetings
- Use chat tools to triage findings instantly
- Celebrate impact, not just completion
Distributed teams using cloud platforms (like Google Docs, Notion, or futurecoworker.ai) can build, refine, and deploy reports faster, with fewer errors.
Personalization and adaptive reporting
One-size-fits-all is dead. Modern tools let you tailor reports to different audiences, from executive dashboards to deep-dive technical appendices.
| Audience Type | Personalization Tactic | Best Practice | Risk |
|---|---|---|---|
| Executive | High-level summaries | Bullet points, visuals | Oversimplification |
| Technical | Detailed appendices | Data tables, methods | Data overload |
| Client | Branding, focused metrics | Custom charts, context | Privacy missteps |
| Public | Infographics, plain language | Jargon-free, compliance | Loss of nuance |
Table 6: Audience types vs. personalization tactics
Source: Original analysis based on Deloitte, 2025
But beware: excessive personalization can erode trust and compromise privacy. Always balance relevance with ethical responsibility.
Section conclusion: Future-proof your reporting
AI, collaboration, and adaptive design are the new normal. Master these, and you’ll future-proof your reporting in an era of relentless change and complexity.
The future of reporting: Trends, risks, and ethical frontiers
Reporting in 2025 and beyond: What’s next?
We’re entering the era of real-time dashboards, natural language reporting, and immersive data experiences. As digital content spending hits $126B in 2024 (up 9% year-over-year, Variety), organizations are doubling down on tech that delivers instant answers.

Three possible scenarios: 1) AI-driven reporting becomes the backbone of all decision-making; 2) Privacy and trust concerns spark a return to more manual, human-audited reports; 3) Hybrid models dominate, blending the best of both worlds.
The dark side: Bias, manipulation, and data privacy risks
With great power comes great risk. Algorithmic bias, data manipulation, and privacy violations are the dark side of advanced reporting.
- Hidden biases in training data
- Automated cherry-picking of results
- Manipulative visualizations skewing the message
- Inadequate anonymization of sensitive data
- Black-box decision algorithms with no transparency
- Unchecked third-party data sources
The solution? Prioritize transparency, audit your tools, and involve multidisciplinary teams in every step. Integrity is non-negotiable.
How to stay ahead: Skills and mindsets for future reporting
The new era requires more than technical know-how—it demands adaptability, critical thinking, and relentless curiosity.
- Data literacy
- Narrative storytelling
- Visual design mastery
- Ethical reasoning
- Collaboration and feedback
- Tool fluency (AI, automation, cloud)
- Audience empathy
- Continuous learning
AI teammates like futurecoworker.ai help bridge skills gaps, but the hunger to learn is the real differentiator.
Section conclusion: Are you ready for what’s next?
The ground is shifting. Staying ahead means embracing change, seeking new tools, and doubling down on integrity. The next section explores the adjacent skills every pro should master.
Beyond the basics: Adjacent topics every reporting pro should master
Report-driven decision making: From data to action
Reports only matter if they drive action. Integrating reporting into the core of organizational strategy fuels real-world impact.
- Tie every report to a business objective
- Embed actionable recommendations, not just findings
- Measure downstream outcomes of reported insights
- Schedule regular follow-ups on report-driven actions
- Use feedback loops to refine reporting continually
Case in point: A project team reallocated $500K in budget after a breakthrough report exposed hidden costs—demonstrating the tangible value of actionable insights.
Collaboration tools and reporting: The new power combo
Modern reporting is inseparable from collaboration. Integrating with cloud platforms, digital whiteboards, and chat tools transforms reporting from a solo act to a team sport.

But beware: tool overload can fragment information. Best practices include consolidating platforms, setting access permissions wisely, and training teams on effective digital etiquette.
The language of reporting: Jargon decoded
Definition list:
- Executive summary: A concise overview of the report’s purpose, findings, and recommendations—critical for time-starved stakeholders.
- Dashboard: An interactive digital interface displaying real-time metrics and KPIs.
- Data integrity: The accuracy, consistency, and reliability of data throughout its lifecycle.
- Actionable insight: A finding that directly informs or drives a business decision.
- Attribution: Citing sources clearly and transparently within reports.
- Feedback loop: A structured process for gathering user responses and iterating on reports.
- KPI (Key Performance Indicator): A quantifiable measure used to gauge success.
- Compliance: Adherence to legal or regulatory requirements in reporting.
Jargon can alienate your audience and obscure meaning—always translate complex terms and connect with your readers’ real-world experience.
Section conclusion: Expanding your reporting toolkit
Reporting mastery isn’t just about data—it’s about communication, collaboration, and relentless improvement. The broader your toolkit, the more powerful your impact.
Conclusion: Reinventing how you make reports—starting now
Key takeaways and your next steps
Making reports that matter in 2025 is both art and science. From exposing the brutal truths of failure to leveraging AI teammates, the playbook has changed. Every pro needs to rethink assumptions, double down on clarity, and embrace bold new strategies.
- Diagnose your current reporting pain points
- Ruthlessly prioritize audience needs
- Validate every data point before inclusion
- Leverage narrative and visuals for impact
- Choose the right tool for each report, blending AI and human strengths
- Craft actionable calls-to-action for every report
- Measure effectiveness with real feedback loops
- Upskill continuously, learning new tools and techniques
- Champion ethical, transparent reporting at every stage
Reflect, adapt, and act. The reports you make today shape tomorrow’s decisions—don’t settle for average.
The last word: Reporting as power
Reporting is more than paperwork—it’s a lever for change, a catalyst for innovation, and a test of your organization’s attention span. When done right, a single report can spark a revolution.
“In the right hands, a report is a revolution.” — Jordan, analyst (illustrative, synthesizing core message)
So here’s the challenge: stop going through the motions. Make reports that command attention, demand action, and leave a mark. The future belongs to those who can cut through the noise and tell the story that matters.
Sources
References cited in this article
- Pew Research Center(researchworld.com)
- Deloitte 2025 Digital Media Trends(www2.deloitte.com)
- TrendWatching 2025 Report Highlights(trendwatching.com)
- PMC: Poor Statistical Reporting(pmc.ncbi.nlm.nih.gov)
- Uplift Content SaaS Case Studies(upliftcontent.com)
- Pew Research: Public Opinion(pewresearch.org)
- Forrester: Cost of Bad Data(forrester.com)
- XM Institute(xminstitute.com)
- ACFE 2024 Report(wilsonlewis.com)
- Orbit Media Blogging Stats(orbitmedia.com)
- COHN Marketing Annual Report Best Practices(cohnmarketing.com)
- Deltek Clarity Study(stambaughness.com)
- Microsoft Clarity Case Studies(clarity.microsoft.com)
- Deloitte: Clarity in Reporting(deloitte.com)
- Statology Tips(statology.org)
- Brandwatch Design Tips(brandwatch.com)
- ClearPoint Strategy(clearpointstrategy.com)
- Upslide Reporting Automation(upslide.net)
- Reddit Digital Marketing Discussion(reddit.com)
- Quixy Workflow Automation Stats(quixy.com)
- Cube Software Automation(cubesoftware.com)
- Forbes: Automation Challenges(forbes.com)
- Owl Labs State of Hybrid Work(owllabs.com)
- Cisco Hybrid Work Study(newsroom.cisco.com)
- INSEAD Sustainability Case Studies(insead.edu)
- McKinsey Case Studies(mckinsey.com)
- UNDRR GAR 2024(undrr.org)
- Menlo Ventures 2024 AI Report(menlovc.com)
- Accenture AI-led Process Study(newsroom.accenture.com)
- EXL 2024 Enterprise AI Study(exlservice.com)
- Statista: Global Risks 2024(statista.com)
- Emerald Insight: Sustainability Reporting Myths(emerald.com)
- DISA: 2024 Misinformation Landscape(disa.org)
- Poynter: Misinformation Trends(poynter.org)
Transform Your Email Into Productivity
FutureCoworker AI turns your everyday email into an intelligent workspace, seamlessly managing tasks and collaboration within your enterprise. It eliminates the complexity of AI, allowing you to benefit from advanced technology without any technical knowledge. Achieve productivity, streamline processes, and improve team efficiency through natural email interaction, getting tasks done faster and smarter.
Get startedReady to Transform Your Email?
Start automating your tasks and boost productivity today
Frequently Asked Questions
Why do most reports fail to drive decisions?
Most reports fail because they lack emotional resonance and are drowning in numbers, jargon, and disconnected charts that don't connect with what decision-makers actually care about. When trust is low and audiences feel emotionally disconnected, reports become background noise that people tune out, regardless of how accurate the data is.
What does the research say about trust in reports and institutions?
According to Pew Research Center, only 22% of Americans expressed trust in their government as of 2024, and only 44% of citizens across 30 OECD countries expressed trust in their government's information. This low trust extends to business organizations, where it fuels a crisis of ignored insights.
What is the real financial cost of ineffective reporting?
Research from Deloitte's 2025 Digital Media Trends shows that time spent on non-actionable reporting can amount to 30% of total project hours in some industries, resulting in lost revenue, wasted man-hours, and mounting frustration across teams.
What is the key difference between a good report and a bad one?
According to the article, a good report isn't about data—it's about decisions. The focus should be on creating reports that command attention and drive results, rather than just presenting numbers and charts.
Continue Reading
Keep exploring Intelligent enterprise teammate

Report Making in 2026: Why Most Reports Fail
Report making has shifted in 2026. This article explains why most reports go unread, what causes report failure, and which approaches drive actual business decisions.

Report Design: Why Most Business Reports Fail to Drive Decisions
Report design determines whether insights drive decisions or get ignored. This article examines 12 lessons on effective report design based on research showing most executives skim reports.

Create Reports Your Team Actually Uses in 2026 and Beyond
Discover insights about create reports

Report Building in 2026: Why Enterprise Dashboards Are Ignored
Report building shapes enterprise strategy in 2026. This article examines why most reports are ignored, how biases distort them, and what makes reporting actually influence decisions.

Report Writing: What Separates Impact From Obscurity
Report writing determines whether decisions get made or opportunities vanish. This article explains how to structure reports that get read and acted upon.

How to Generate Reports That Actually Drive Decisions
To generate reports that drive decisions, teams must move beyond automation and data silos. This article covers real-world reporting challenges, cost impacts, and actionable strategies.